หน้าแรกของ IC Markets เข้าสู่ระบบ เว็บเทรดเดอร์ ติดต่อเรา
IC Markets Social IC Markets Social

Information Hub for
Serious Traders

  • เกี่ยวกับเรา
  • เปิดบัญชีเทรด
  • เปิดบัญชีเดโม่
  • เริ่มเทรด
  • เยี่ยมชมบล็อกของเรา
IC Markets Social
  • เกี่ยวกับเรา
  • เปิดบัญชีเทรด
  • เปิดบัญชีเดโม่
  • เริ่มเทรด
  • เยี่ยมชมบล็อกของเรา
August 24, 2023Australian_Stocks_enIC Markets

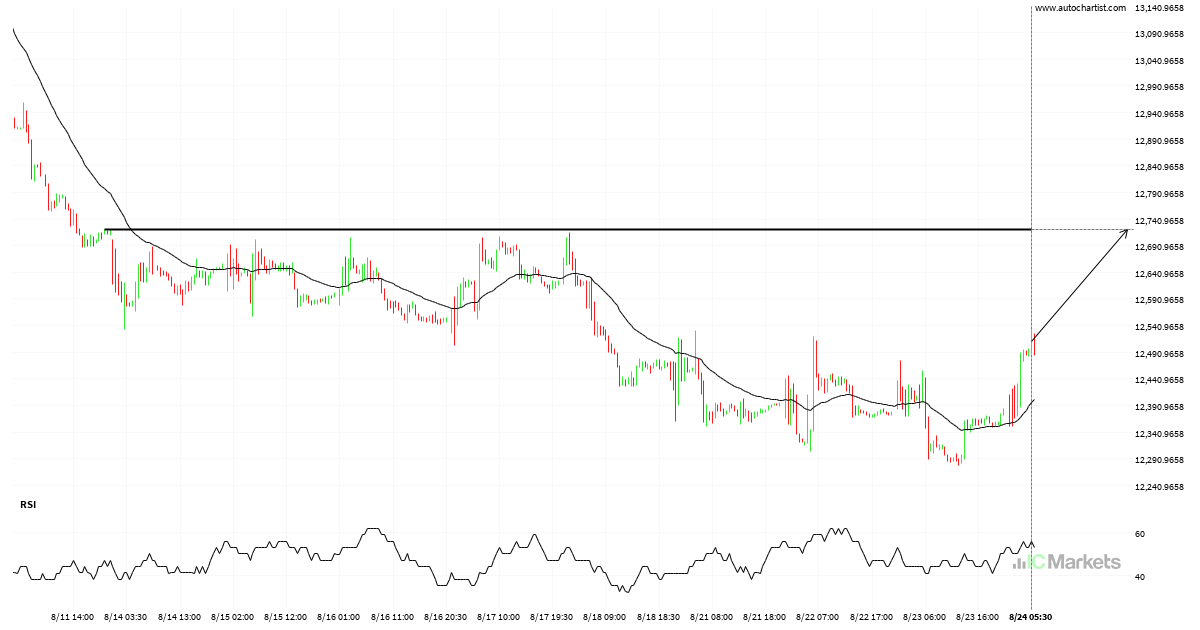
FTSE China A50 Index – getting close to psychological price line

FTSE China A50 Index is moving towards a resistance line. Because we have seen it retrace from this level in the past, we could see either a break through this line, or a rebound back to current levels. It has touched this line numerous times in the last 13 days and may test it again […]

Read more
August 23, 2023Australian_Stocks_enIC Markets

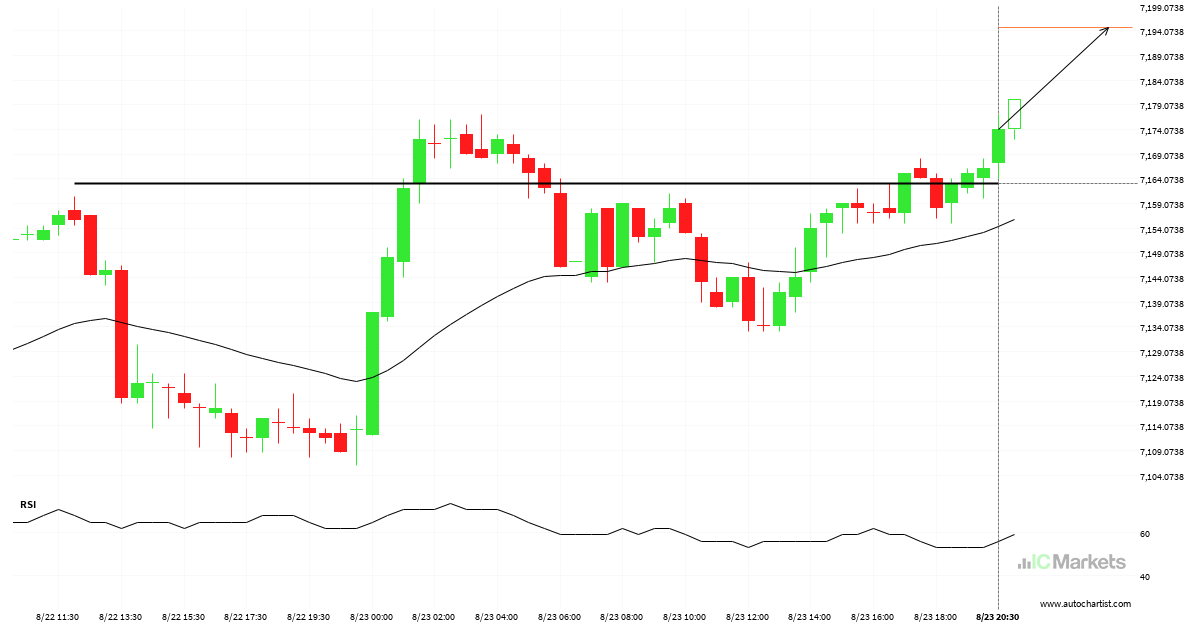
Australia 200 Index broke through important 7163.0898 price line

Australia 200 Index has broken through a resistance line. It has touched this line numerous times in the last 2 days. This breakout shows a potential move to 7194.6460 within the next 6 hours. Because we have seen it retrace from this level in the past, one should wait for confirmation of the breakout.

Read more
August 23, 2023Australian_Stocks_enIC Markets

Hong Kong 50 Index – getting close to psychological price line

Hong Kong 50 Index is moving towards a resistance line. Because we have seen it retrace from this level in the past, we could see either a break through this line, or a rebound back to current levels. It has touched this line numerous times in the last 7 days and may test it again […]

Read more
August 22, 2023Australian_Stocks_enIC Markets

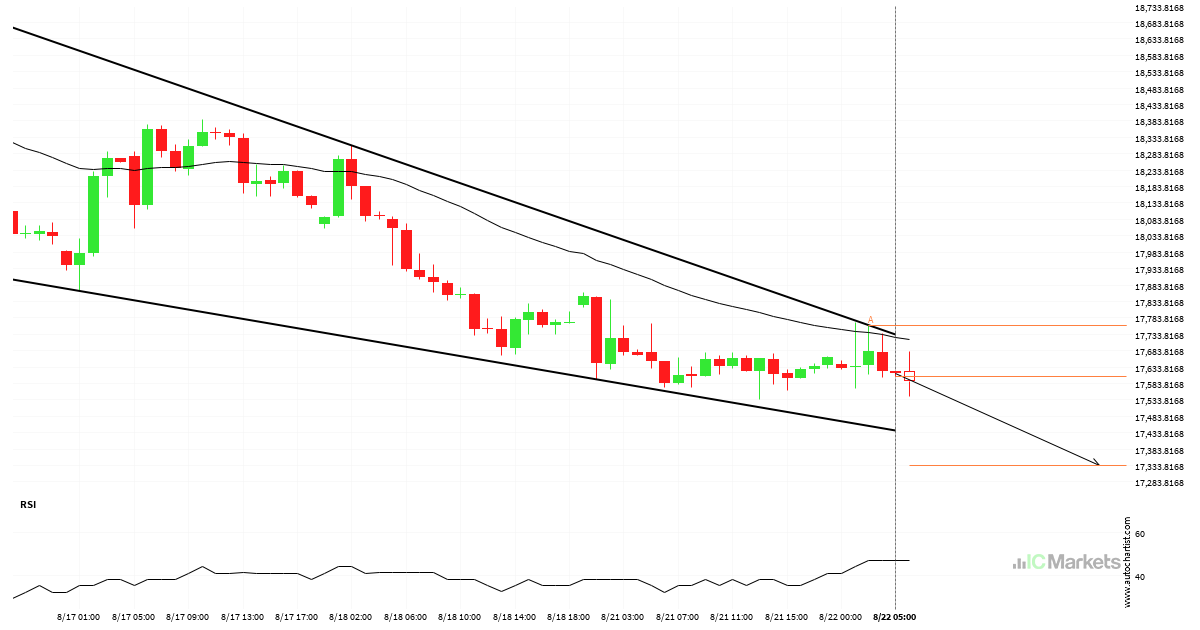
Hong Kong 50 Index approaching support of a Falling Wedge

Hong Kong 50 Index is approaching the support line of a Falling Wedge. It has touched this line numerous times in the last 12 days. If it tests this line again, it should do so in the next 18 hours.

Read more
August 21, 2023Australian_Stocks_enIC Markets

Australia 200 Index – getting close to psychological price line

Australia 200 Index is moving towards a support line. Because we have seen it retrace from this level in the past, we could see either a break through this line, or a rebound back to current levels. It has touched this line numerous times in the last 4 days and may test it again within […]

Read more
August 20, 2023Australian_Stocks_enIC Markets

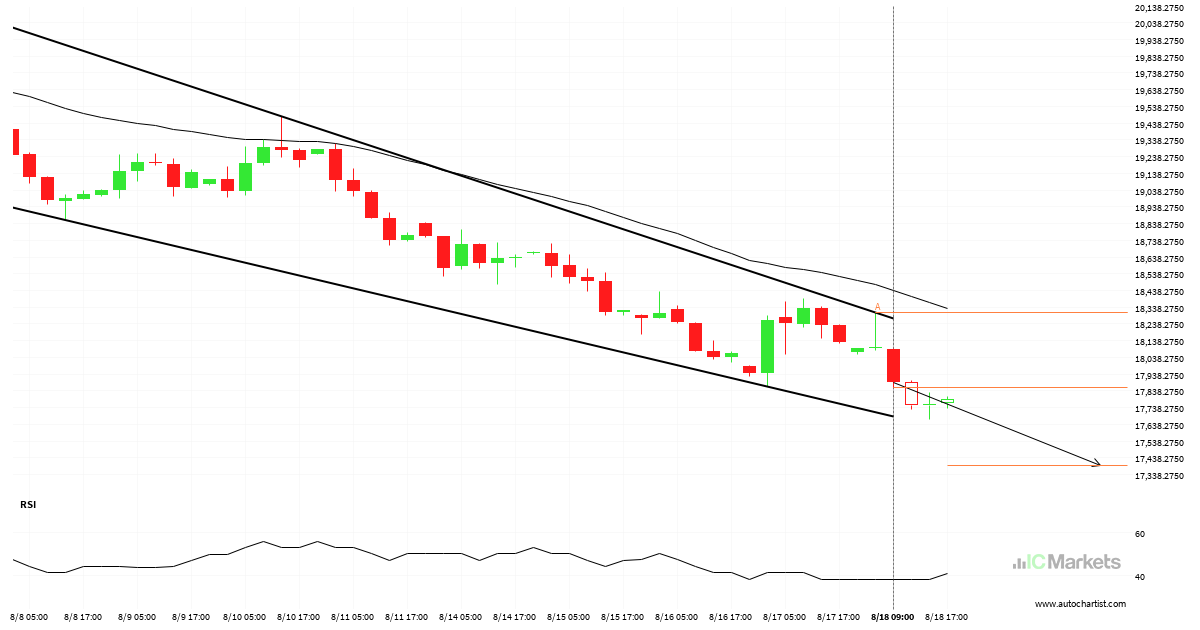
Hong Kong 50 Index approaching support of a Channel Down

Hong Kong 50 Index is approaching the support line of a Channel Down. It has touched this line numerous times in the last 15 days. If it tests this line again, it should do so in the next 2 days.

Read more
August 18, 2023Australian_Stocks_enIC Markets

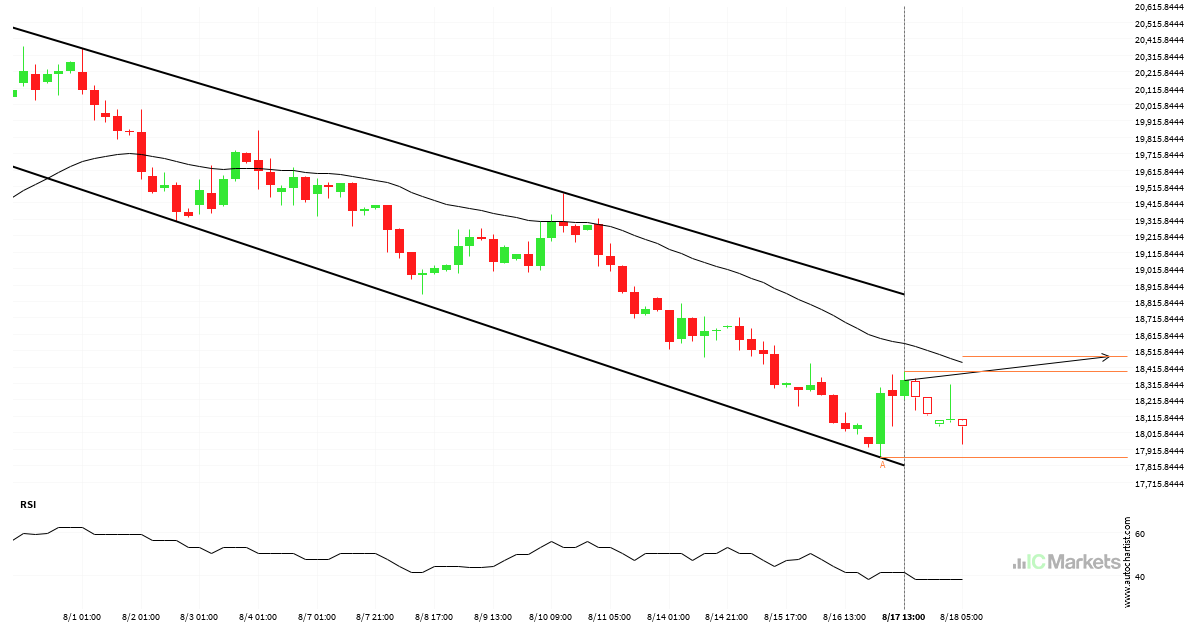
Hong Kong 50 Index approaching resistance of a Channel Down

Hong Kong 50 Index is approaching the resistance line of a Channel Down. It has touched this line numerous times in the last 25 days. If it tests this line again, it should do so in the next 4 days.

Read more
August 17, 2023Australian_Stocks_enIC Markets

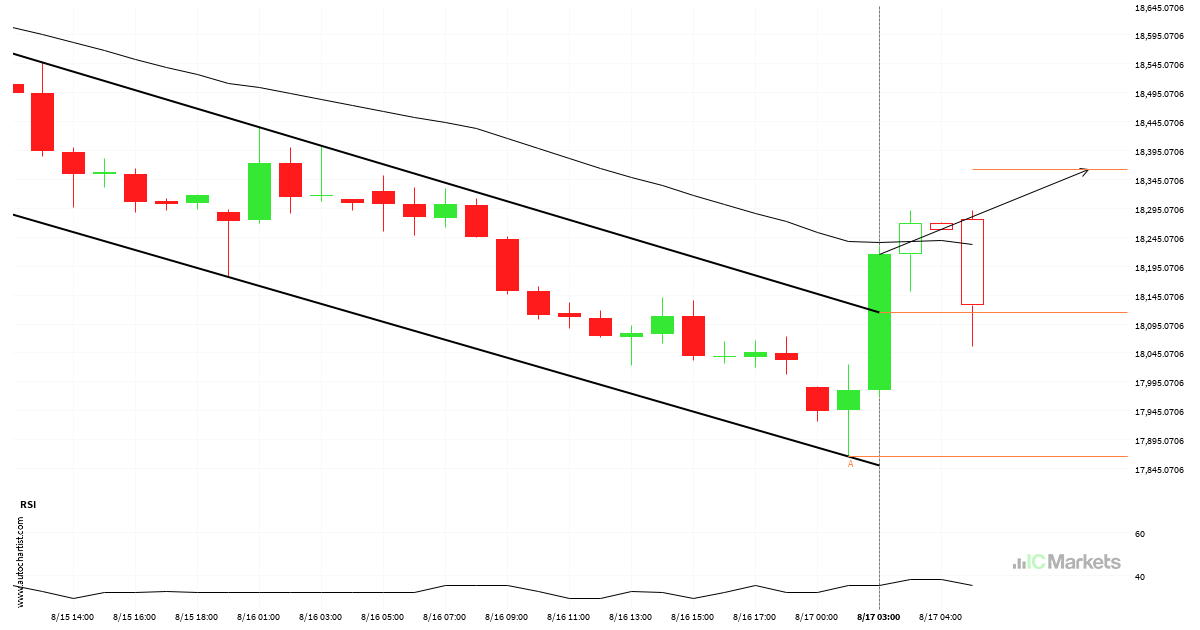
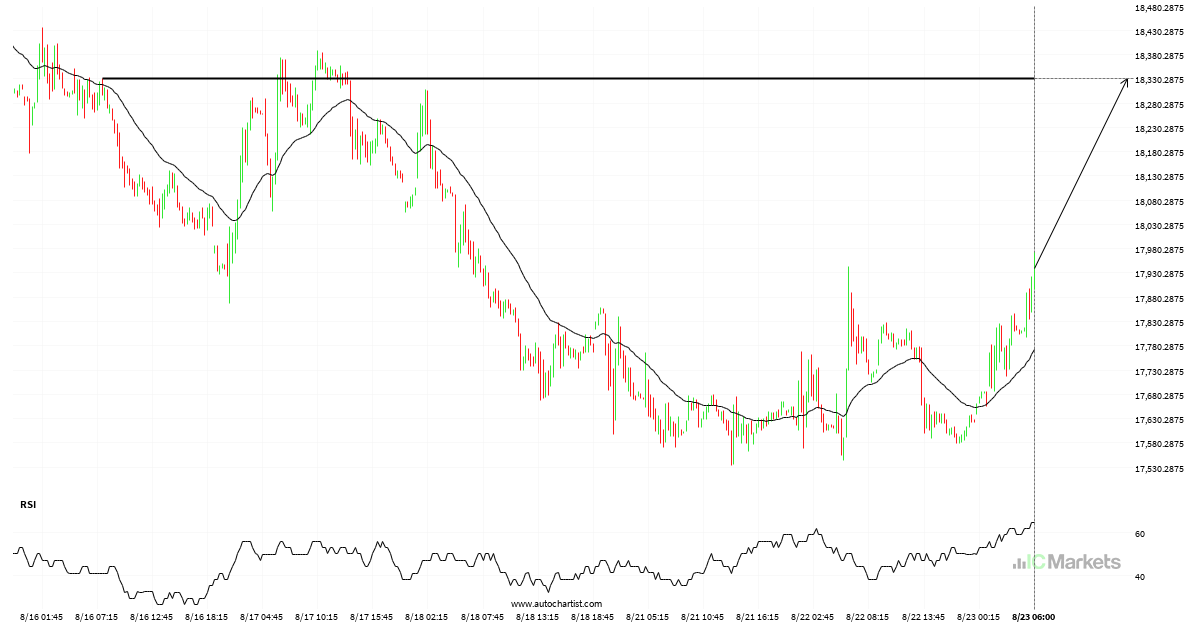
Hong Kong 50 Index has broken through resistance

Hong Kong 50 Index has broken through a resistance line. It has touched this line at least twice in the last 3 days. This breakout may indicate a potential move to 18362.8044 within the next 5 hours. Because we have seen it retrace from this position in the past, one should wait for confirmation of […]

Read more
August 16, 2023Australian_Stocks_enIC Markets

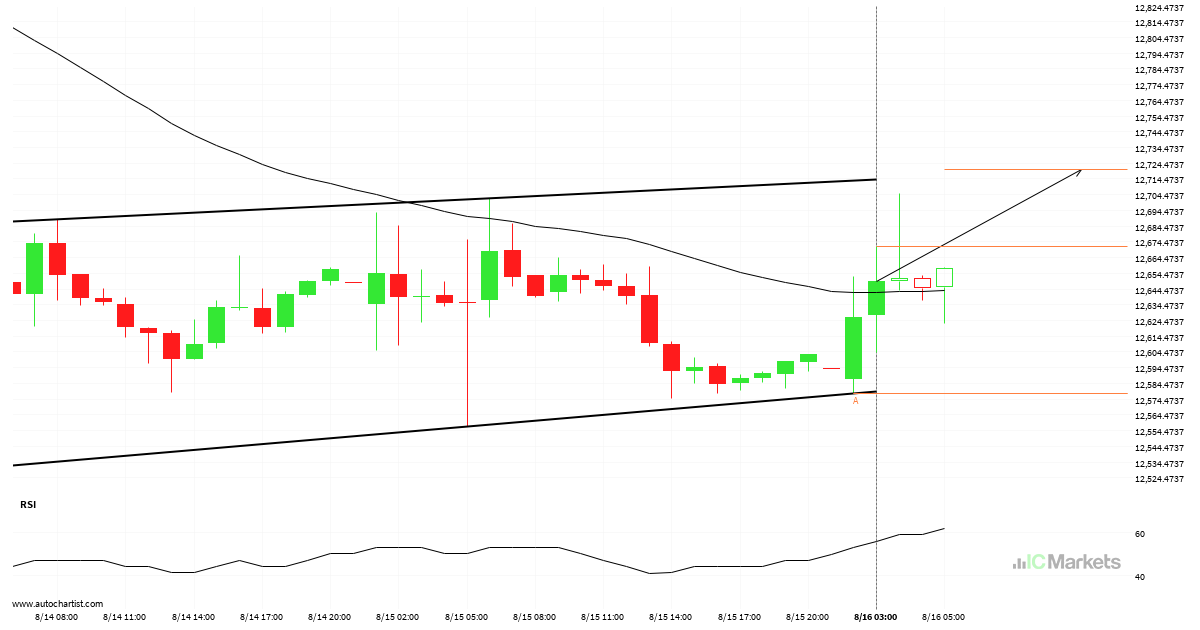
FTSE China A50 Index approaching resistance of a Channel Up

FTSE China A50 Index is approaching the resistance line of a Channel Up. It has touched this line numerous times in the last 3 days. If it tests this line again, it should do so in the next 8 hours.

Read more
August 14, 2023Australian_Stocks_enIC Markets

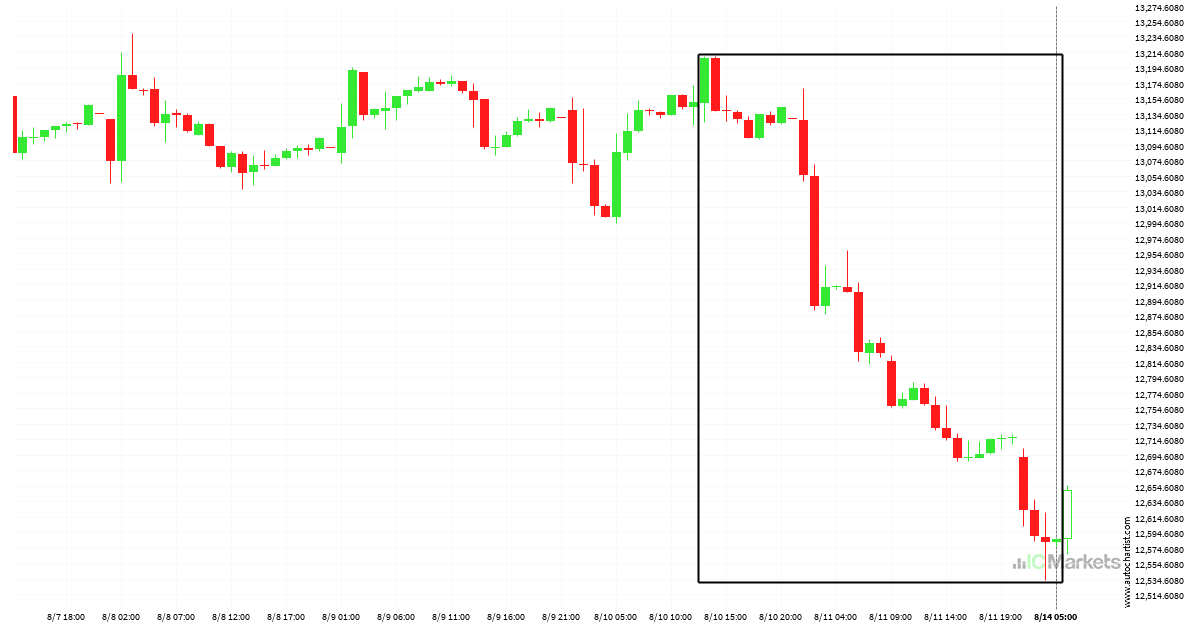
Huge bearish move on FTSE China A50 Index

FTSE China A50 Index has moved lower by 4.7% from 13206.8 to 12585.93 in the last 4 days.

Read more
  • 1
  • 2
  • 3
  • …
  • 31
  • 32
  • 33
  • 34
  • 35
  • 36
  • 37
  • …
  • 153
  • 154
  • 155

Recent Posts

  • US Wall Street 30 Index – المستوى الرئيسي – مقاومة
  • Brent Oil vs US Dollar – نموذج الرسم البياني – قناة صاعدة
  • Brent Oil vs US Dollar – نموذج الرسم البياني – قناة صاعدة
  • Hong Kong 50 Index – نموذج الرسم البياني – مثلث صاعد
  • Hong Kong 50 Index – รูปแบบกราฟ – สามเหลี่ยมขาขึ้น

Recent Comments

    Translation


     Edit Translation

    เปิดบัญชีและฝากเงินได้แบบทันที

    เทรดได้ภายในไม่กี่นาที!

    เริ่มต้น ลองบัญชีเดโมได้ฟรี

    การเทรดฟอเร็กซ์

    • ภาพรวมของบัญชี
    • เปิดบัญชี
    • ใช้งาน Web Trader

    รายละเอียดของการซื้อขาย

    • สเปรดและค่าคอมมิชชั่น
    • ขอบเขตของตลาด
    • ช่วงเวลาซื้อขาย
    • การเพิ่มเงิน
    • การถอนเงิน

    เกี่ยวกับ IC Markets

    • Help Centre
    • ทำไมถึงต้องเป็น IC Markets
    • กฎระเบียบ
    • เอกสารทางกฎหมาย
    • ติดต่อเรา


    Forex Trading

    • Accounts Overview
    • Open an Account
    • Launch Web Trader

    Trading Specifications

    • Spreads and Commissions
    • Range of Market
    • Trading Hours
    • Funding
    • Withdrawal

    About IC Markets

    • Chat with a Specialist 24/7
    • Why IC Markets
    • Regulation
    • Legal Documents
    • ติดต่อเรา

    ข้อความจำกัดความรับผิดชอบ: เนื้อหาข้อมูลนี้เป็นเนื้อหาด้านการตลาดซึ่งได้ถูกเผยแพร่เพื่อวัตถุประสงค์ในการให้ข้อมูลเท่านั้น เนื้อหานี้ไม่ได้ประกอบไปด้วยและไม่ควรถือว่าประกอบไปด้วยคำแนะนำหรือการเสนอแนะด้านการลงทุน หรือการแนะนำให้มีการดำเนินการใดๆ กับตราสารทางการเงิน วิดเจ็ตที่แสดงอยู่ภายในเป็นของผู้จัดทำจากภายนอกและ IC Markets ไม่มีส่วนรับผิดชอบใดๆ เกี่ยวกับเนื้อหาและผลกระทบที่มีต่อการเทรด

    สงวนลิขสิทธิ์สำหรับเนื้อหาทั้งหมด ความคิดเห็นของผู้จัดทำอาจไม่สอดคล้องกับความคิดเห็นของผู้จัดทำบล็อก เมื่อมีการคัดลอกเนื้อหาจากเว็บไซต์นี้หรือมีการเชื่อมโยงไปยังฟีด RSS เพื่อเผยแพร่บทความของเรา ผู้ที่ทำการคัดลอกจะต้องใส่ลิงก์ไปยัง IC Markets หรือมีการระบุแหล่งที่มาในรูปแบบ ‘IC Markets Blog’ สำหรับคำถามโดยทั่วไปโปรดติดต่อสำนักงานบรรณาธิการผ่านทางแบบฟอร์มบนหน้าติดต่อเรา

    คำเตือนเกี่ยวกับความเสี่ยง: การเทรดตราสารอนุพันธ์มีความเสี่ยงในระดับสูงกับเงินทุนของคุณและคุณควรทำการเทรดด้วยเงินที่คุณ สามารถรับการขาดทุนได้เท่านั้น การเทรดตราสารอนุพันธ์อาจไม่เหมาะกับนักลงทุนทุกท่าน ดังนั้นโปรดทำความเข้าใจกับความเสี่ยงที่เกี่ยวข้องและหาคำแนะนำที่เป็นอิสระหากจำเป็น นักลงทุนควรศึกษา Product Disclosure Statement (PDS) ก่อนทำธุรกรรมใดๆ กับเรา

    เนื้อหาข้อมูลที่ถูกแสดงอยู่บนหน้านี้เป็นข้อมูลโดยทั่วไปเท่านั้นและไม่ได้มีการคำนึงถึงสถานการณ์ส่วน ตัวของคุณ, เป้าหมายทางการเงิน หรือความต้องการของคุณ คุณเป็นผู้พิจารณาว่าผลิตภัณฑ์ต่างๆ ที่เรามีให้บริการเหล่านี้ตรงกับความต้องการของคุณหรือไม่ อีกทั้งคุณไม่ควรทำการเทรดกับเราจนกว่าคุณจะเข้าใจถึงคุณสมบัติและความเสี่ยงที่เกี่ยวข้องกับผลิตภั ณฑ์ที่เรามีให้บริการ นั่นหมายความว่าคุณอาจต้องการคำแนะนำที่เป็นอิสระก่อนที่คุณจะเริ่มต้นเทรดกับเรา

    © 2022 Raw Trading Ltd | All rights reserved.
    • Sample Page